

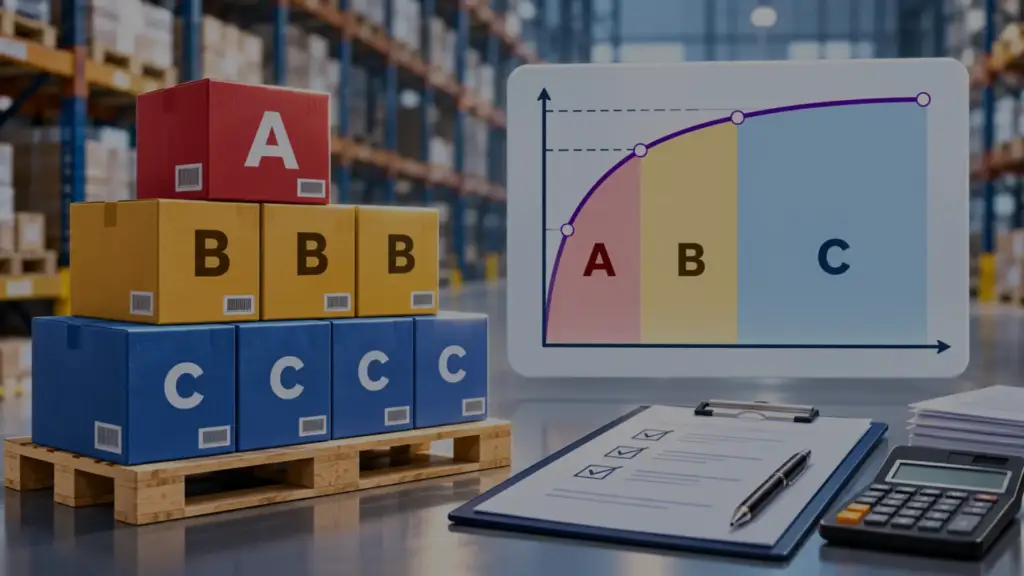
ABC inventory analysis is a method of classifying stock items into three groups by their contribution to total annual consumption value, so that control effort is matched to importance. Class A items account for most of the value and receive the tightest control. Class B items are intermediate. Class C items are numerous but account for little value and are managed with minimal effort.
It is based on the Pareto principle, the observation that a small proportion of items usually accounts for the large majority of value. It is sometimes called Always Better Control analysis.
Importan of ABC Analysist in Inventory Management?
No business has enough planning attention to manage every SKU closely. A distributor with 8,000 items cannot review each one weekly, and trying to do so means every item gets the same shallow treatment regardless of whether it represents a large share of working capital or a negligible one.
ABC analysis fixes where effort goes.
- Focused control: Planner time, forecast review, and management attention go to the items where errors are expensive.
- Working capital: Most inventory value sits in a small number of items. Tightening those releases cash, while tightening Class C items releases almost none.
- Cycle counting: Count frequency is set by class rather than applied uniformly, which raises record accuracy where it matters without raising counting labour overall.
- Service level setting: Different classes can carry different target service levels and therefore different safety stock, instead of one blanket policy.
- Supplier negotiation: Class A items are where price and terms negotiation produces real savings.
- Practical ordering policy: Class C items can be ordered in larger, less frequent quantities, because the holding cost of over-ordering a low-value item is less than the administrative cost of managing it closely.
How ABC Inventory Analysis Work?
Calculation
- For each item, calculate annual consumption value: annual usage in units × unit cost.
- Sort all items from highest annual consumption value to lowest.
- Calculate each item’s percentage of total annual consumption value.
- Calculate the running cumulative percentage down the sorted list.
- Draw the class boundaries on the cumulative percentage.
Typical boundaries
| Class | Share of items | Share of annual consumption value |
|---|---|---|
| A | about 10 to 20 percent | about 70 to 80 percent |
| B | about 30 percent | about 15 to 20 percent |
| C | about 50 percent | about 5 to 10 percent |
These are conventions, not rules. The boundaries are set where the cumulative curve flattens in the actual data, and some businesses use more classes, for example A to E, where the range is wide.
Control policy by class
| Class A | Class B | Class C | |
|---|---|---|---|
| Review | Frequent, individually | Periodic | Infrequent, by exception |
| Forecasting | Detailed, reviewed by a planner | Standard statistical | Simple, rule based |
| Cycle counting | Most frequent | Moderate | Least frequent |
| Safety stock | Calculated per item, high service target | Standard | Generous but rarely reviewed |
| Order quantity | Smaller, more frequent | EOQ based | Larger, less frequent |
| Supplier management | Negotiated, performance tracked | Monitored | Minimal |
What Are the Key Components of ABC Analysis?
- Annual consumption value: Annual usage multiplied by unit cost. This is the ranking basis, not unit price alone and not unit volume alone. A cheap item used in very high volume can be Class A.
- Cumulative percentage: The running total used to place class boundaries.
- Class boundaries: Set by inspection of the actual curve rather than forced to textbook percentages.
- Reclassification cycle: Items move between classes as demand and prices change, so the analysis is rerun periodically, commonly quarterly or half-yearly.
Limitations to be aware of
- It ranks by value, so a low-value item that is operationally critical, such as a safety component or a part that halts a production line, will fall into Class C and be under-managed unless treated as an exception.
- It is backward looking. New products, seasonal items, and items with shifting demand are classified on history that may not hold.
- Classes are unstable. A meaningful share of items can change class each time the analysis is rerun, which creates churn if policies are rewritten every time.
- It adds little where all items have similar consumption values.
- It considers each item in isolation and ignores whether items are bought from the same supplier or ship in the same consignment.
A common fix is to combine ABC with a second dimension: criticality (often called VED analysis, for vital, essential, desirable) or demand variability (XYZ analysis). An item can then be Class C by value but vital by criticality, and be managed accordingly.
ABC Inventory Analysis Example: A Practical Supply Chain Scenario
A distributor reviews ten SKUs by annual consumption value.
| Item | Annual units | Unit cost (₹) | Annual value (₹) | Share | Cumulative | Class |
|---|---|---|---|---|---|---|
| SKU-01 | 1,800 | 1,250 | 22,50,000 | 45.0% | 45.0% | A |
| SKU-02 | 900 | 1,400 | 12,60,000 | 25.2% | 70.3% | A |
| SKU-03 | 4,000 | 95 | 3,80,000 | 7.6% | 77.9% | B |
| SKU-04 | 2,500 | 130 | 3,25,000 | 6.5% | 84.4% | B |
| SKU-05 | 600 | 480 | 2,88,000 | 5.8% | 90.1% | B |
| SKU-06 | 12,000 | 14 | 1,68,000 | 3.4% | 93.5% | C |
| SKU-07 | 30,000 | 4 | 1,20,000 | 2.4% | 95.9% | C |
| SKU-08 | 9,000 | 10 | 90,000 | 1.8% | 97.7% | C |
| SKU-09 | 50,000 | 1.50 | 75,000 | 1.5% | 99.2% | C |
| SKU-10 | 20,000 | 2 | 40,000 | 0.8% | 100.0% | C |
| Total | 49,96,000 |
Two items out of ten, 20 percent of the range, account for about 70 percent of annual value. Three more account for about 20 percent. The remaining five, half the range, account for under 10 percent.
The distributor reviews SKU-01 and SKU-02 weekly, calculates safety stock individually, counts them monthly, and negotiates pricing and lead time with those suppliers directly. Class C items move to a simple reorder policy with larger order quantities and a count twice a year.
Note that SKU-09 is the highest-volume item in the range at 50,000 units a year, and still falls in Class C. Volume alone does not determine class.
Related Terms
- Inventory Turnover
- Safety Stock
- Reorder Point
- Economic Order Quantity (EOQ)
- Cycle Counting
- Dead Stock
- Demand Forecasting
- Warehouse Slotting
Join The Community

Recent Glossary




FAQs
Q1. Is ABC analysis based on unit price?
No. It is based on annual consumption value, which is annual usage multiplied by unit cost. A low-priced item consumed in very large quantities can be Class A, and an expensive item bought twice a year can be Class C.
Q2. How often should the analysis be rerun?
Commonly quarterly or half-yearly. More often than that creates policy churn, since items move between classes on small changes in demand or price.
Q3. What about a cheap part that stops production if it runs out?
That is the main weakness of value-based classification. Such items are handled as exceptions, or ABC is combined with a criticality classification (VED analysis) so that vital items are controlled regardless of value.
Q4. Can ABC analysis be applied to anything other than inventory?
Yes. The same ranking logic is applied to suppliers by spend, customers by revenue, and SKUs by picking frequency for warehouse slotting decisions.